
We already reviewed the typical tasks of the mixing stage and, discussed about the 3 dimensions of mixing.
There are some techniques and tools destined to modify the sound dynamics and, that are broadly used, during the mixing phase and during the masterizing phase (but, in different ways).
Before talking about compressors, decompressors and limiters, we should first understand what the term "sound dynamics" mean and, the most important, what "dynamic range" means.
Sound dynamics
Even if two different instruments (by example, a guitar and a trumpet) play the same note, there is clear difference in the sound produced by each one. The fingerprint of each instrument is totally different.
Apart of the fundamental note, each instrument generates other frequencies of minor order (harmonics, overtones...), which content and intensity highly varies from instrument to instrument.
This characteristic fingerprint of each instrument is what is being called timber.
Apart of this relationship between the fundamental note, harmonics and overtones, we can analyze how the sonic wave evolute with the time. Probably the acronym ADSR (Attack, Decay, Sustain and Release) is familiar to you. Lately, we can even talk about ADSHR, if we include the Hold phase between Sustain and Release.
Next picture shows the different phases of a note C emitted by a clarinet.
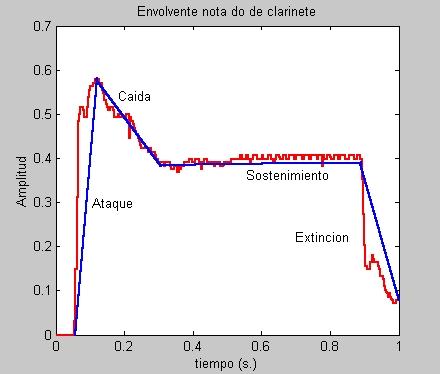
Ataque = Attack
Caída = Decay
Sostenimiento = Sustain
Extinción = Release
Axis are: Volume (Amplitud) and Time (tiempo).
The particular relationship between Volume and Time is being called the Volume Envelope.
Apart of the timber, the way as the same note varies along the time is very different from instrument to instrument, also. Even the same instrument, depending on the interpretative intention, can have different curves for same note (by example, if we play the guitar with fingers or a pick, if we play harder or softer...). Even that the timber is the same, the ADSR curve is different.
The Attack phase is the ramp from the beginning of the sound until the sound reaches its higher volume. Is a very short time, where the volume goes from zero to maximum.
Once the maximum volume has been reached, the volume drops (Decay) until reaches certain level, that is being maintained for a while (Sustain). When we stop acting on the instrument, this sound starts to fade out (Release). Lately, a new phase was introduced (Hold), between Sustain and Release, because the sound drops quickly after the sustain but, it's maintained for a while in the same low volume before definitively fade out (release).
The time that each note played by each instrument stays in each of the ADSHR phases is what is known as the sound dynamics (the way it moves).
Compressors, Decompressors, Limiters, Gates and similar dynamics tools are all affecting to one or more parameters of that envelope, re-shaping the final 'look' of such a curve. The timber remains the same but, the sound dynamic is being modified.
Dynamic Range
This is a very important concept, as soon as we start to alter the sound dynamics during our musical production.
The maximum volume of a track is being known as a peak volume. During the reproduction of a track, there are certain instants of time where volume reaches peaks, way over the average volume level of the track.
Usually, the Attack phase of each note the responsible for such a peaks, while the average volume level is associated to the Sustain phase.
The loudness of the track is the perceived volume. Don't confuse loudness with volume. Volume is a measurable value (by example, decibels of sound pressure), while the perceived volume (or loudness) is a subjective value, that depends on the hearer and, isn't measurable.
Contrary to what you could think, what really determines the loudness is the Average Volume of the track and, not the peak volume.
The Average Volume is being measured with the RMS (Root Mean Square) method, a mathematical formula that calculates the average volume of an audio signal.
If, for a certain fragment (that can be all the track or song), the maximum peak volume is of +6dB and, during the same fragment we are having a RMS of -18dB, we will say that we have a Dynamic Range of 12 dB (abs(18) - abs(6) = 12 dB).
So, the Dynamic Range is the margin of decibels between the RMS and the peak value for a certain sound fragment.
To check the dynamic range of any part, track or complete mix, it's very useful to have some meter. I personally use the TT Dynamic Range Meter (see picture below).

The bigger bar, close to the narrower one, represents average RMS and, the actual value is being represented on the bottom, in RMS boxes (-12.0 Left / -12.3 Right).
The two center bars are the current dynamic range of each channel (differences between RMS peaks and RMS averages).
Ok, Ok... what a nice meter but... all this for what?.
Be patient, here we go.
People that is currently ruling Masterizing are claiming that there is a loudness war in musical productions, to achieve a mix with the maximum loudness. The more we rise RMS, less difference between the average volume and peak volume. The sound becomes compressed and lacks expression, accents, forming a sonic wall of sound.
Then, which is an acceptable dynamic range?. It all depends on the destination of the musical production.
Without using compression, the sound generated by a philharmonic orchestra has a dynamic range between 20 and 24 dB.
For Classic Music and Cinema, Katz recommends a dynamic range of, at least, 20 dB.
For Pop and Radio, a range around 14 dB (Radio Broadcasters process each material, maximizing it to homogenize the volume of every thing they emit; this values ensures a good result after their processing).
For a harder musical style but, maintaining expressivity and dynamics, a range around 12 dB.
By example, recordings of Led Zeppelin, Jimi Hendrix and rest of the icons of rock of that era, have dynamic ranges between 10 and 11 dB (some songs a lesser of 8 dB, some songs a greater range of 12 dB). Those, I've been personally measured with the TT Dynamic Range tool.
Katz, among many others, consider that was during that epoch were the best recordings were made, reaching the loudness to the right level, while maintaining the quality and nuances of the sound.
For sure, the ear is the final judge but, it is true that I am always trying to achieve a dynamic range between 8 and 12 dB for hard rock and, I always take a look to the meter while working with compressors, to clearly see if I am overdoing the effect.
Alright, alright... but... this translates to what?.
When we are mixing, and very specially while masterizing, we are fixing a Ceil value close to 0 dB (by example, -0.5 dB), as the maximum peak value that our mix can reach. Note that values higher than -0.3 dB will produce clipping and overs during further digital processing in other equipment.
If our maximum peak (limiter Ceil) is of -0.5 dB and, we wanted to maintain a dynamic range of 11 dB, to properly represent our mix, our RMS should be around -11.5 dB. This is the maximum loudness level that we can offer.
We will see the importance about all this when we describe how an audio compressor and limiter work.
To easily control this aspect, Bob Katz designed the meters for his K-System (K-20, K-14 and K-12).
Depending on the destination of our mix (as mentioned above), your goal is a dynamic range of 20 dB (for Cinema), 14 dB (Radio, Pop) or 12 dB (harder music) and, therefore, you choose the corresponding meter.
Every time that your RMS are around the 0 mark and, every time that your Peak RMS aren't constantly in the red zone of the meter, you will achieve a powerful mix, with a good dynamic range.
For this purpose (and many others), I am personally using the IXL Inspector by RNDigital, that implements the 3 K-System meters (among others).

In the above picture, a track measured with a K-20 meter. You can see that RMS are in the red zone and, they are there constantly. This track would be very compressed if it was a Classic piece.
Let see same track analyzed thru a K-14 meter.

Now, we can see that the music isn't in the red zone but, they are constantly in the yellow zone.
This track would be adequate for pop but, it could be heard as excessively compressed if we send it to a Radio Broadcast.
Let see the same with a K-12 meter.

Even that the RMS are still on the yellow zone, they are way below the +4 dB limit (fortisimo) and, they reach such a zone very sporadically. The red zone is shortly reached in very punctual moments during the song. We are in a dynamic range very acceptable for a Rock mix.
If I rise the compressor gain, in the mix bus (exaggeratedly), we will see that the RMS are permanently in the Red zone.

This mix will sound really loud (because RMS are very close to peak values) but, it will sound very compressed and, probably tasteless (even that this is difficult with Sonnox plugins and more evident in other less sophisticated plugins).
To be continued ...
Before discussing about the dynamics tools, as compressors, limiters, decompressors and gates, I've considered as necessary to introduce the concepts of sound dynamics and dynamic range, because those are the aspects being modified by those tools.
Once those concepts are clear, we will see in a next entry how those tools affect the sound dynamics and dynamic range.
No comments:
Post a Comment
Please, feel free to add your comments.